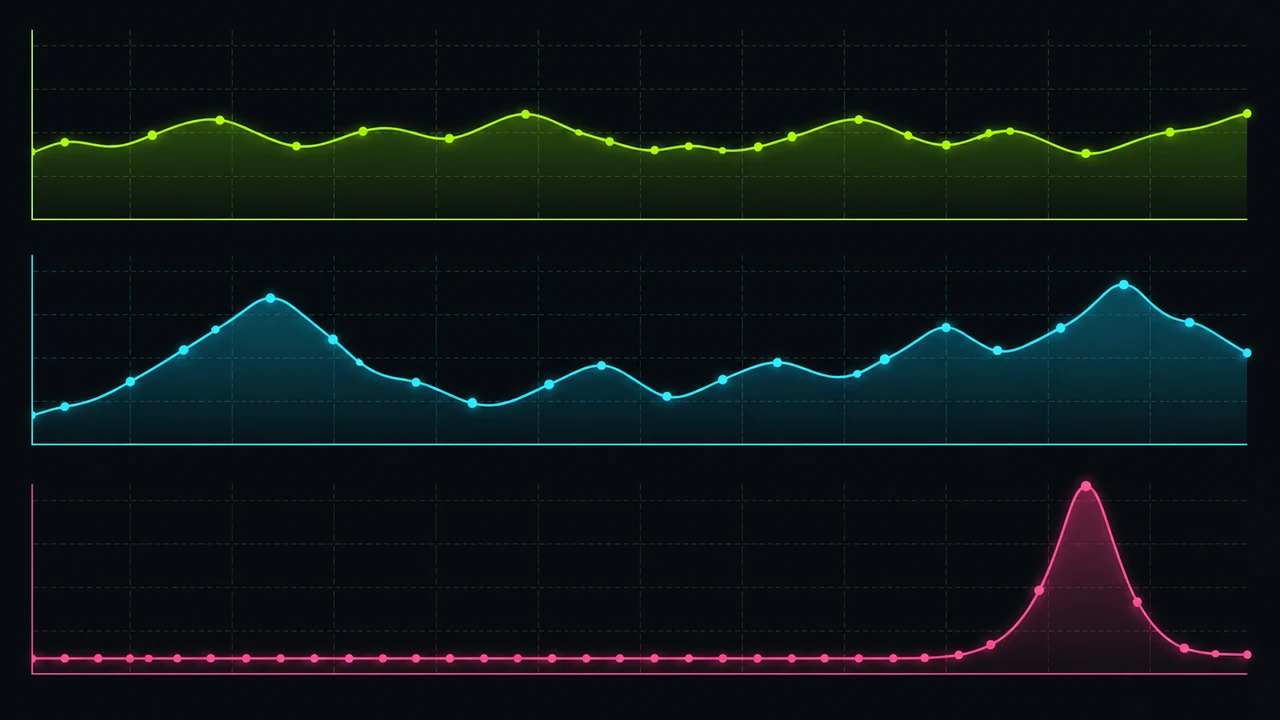
- Measures
- Spread of round outcomes
- Units
- Multiples of stake
- Band narrows with
- Square root of rounds played
- Predicts your session
- No
Volatility is a measure of spread, not of size
Put precisely, volatility is the standard deviation of the return from one round of a pokie, expressed in multiples of the amount staked. The return from a round is a random variable. Its mean is the return to player. Its standard deviation is the volatility. Both describe the same distribution from different directions: one says where the centre is, the other says how wide it is around that centre.
The units matter more than they look. Because the figure is stated per unit of stake, it carries no currency. Doubling your stake doubles the dollar size of every swing and doubles the modelled loss in the same proportion, so the ratio between them is untouched. The consequence kills a popular idea before the page properly starts: no change of stake changes a game's volatility. Stake sets the scale of the story. The maths sets its shape.
Volatility is also not hit frequency, and the two get swapped constantly. Hit frequency counts how often a round returns anything at all. Volatility weights outcomes by how much they return, after squaring them. A pokie can return something on most spins and still be enormously dispersed, if nearly all of those returns sit below the stake and the average is being carried by one rare event. Mean, frequency and spread are three independent descriptions of one distribution, and knowing two of them does not give you the third.
A pokie's per-round distribution is also severely right-skewed: a large mass at zero, a cluster of small returns, then a thin tail running to the maximum-win cap. Standard deviation compresses that into one width, so two games of equal width can have differently shaped tails.


18+ · Bonus conditions
Offer information supplied: 2026-10-05.


18+ · Bonus conditions
Offer information supplied: 2026-10-05.
Where the number comes from
The figure is computed from the mathematical model, not measured by watching people play, and the construction is worth following once because every misuse of volatility traces back to a step in it. Take the game's complete list of distinct outcomes with the probability of each. Multiply each probability by that outcome's return in stake multiples and add them up: the sum is the mean, which is the return to player. Now do it again, squaring each return before weighting it, and subtract the square of the mean from that second sum. What remains is the variance. Its square root is the volatility.
The squaring step is the entire mechanism, and it is where the intuition lives. Because returns are squared before they are weighted, an outcome worth a thousand stakes contributes a million times as much to the variance as an outcome worth one stake, while contributing only a thousand times as much to the mean. The top of the paytable therefore dominates the volatility while barely moving the return figure. That is why “high volatility” and “most of the designed return sits inside the feature” are the same statement made twice, and why a large maximum-win cap is a reliable tell even when no volatility label is published.
Technical standards for gaming machines generally do not use the raw standard deviation. They use a volatility index: the standard deviation multiplied by a confidence multiplier from the normal distribution, roughly 1.96 for a 95% interval and roughly 1.65 for a 90% one. Those multipliers are statistics rather than properties of any game, and their job is to turn a width into a range you can read.
The useful part is what the index lets you compute. Divide it by the square root of the round count and you have the half-width of the interval around the design return after that many rounds. Volatility sits in the numerator of that expression, which is why dispersion needs a page of its own: two games built to the same design return can require wildly different volumes of play before an observed return settles near it, and the one holding its return in a rare event requires far more. Run the division backwards and it answers a concrete question — how many rounds before the band means anything — and for a dispersed game that is a volume nobody reaches.
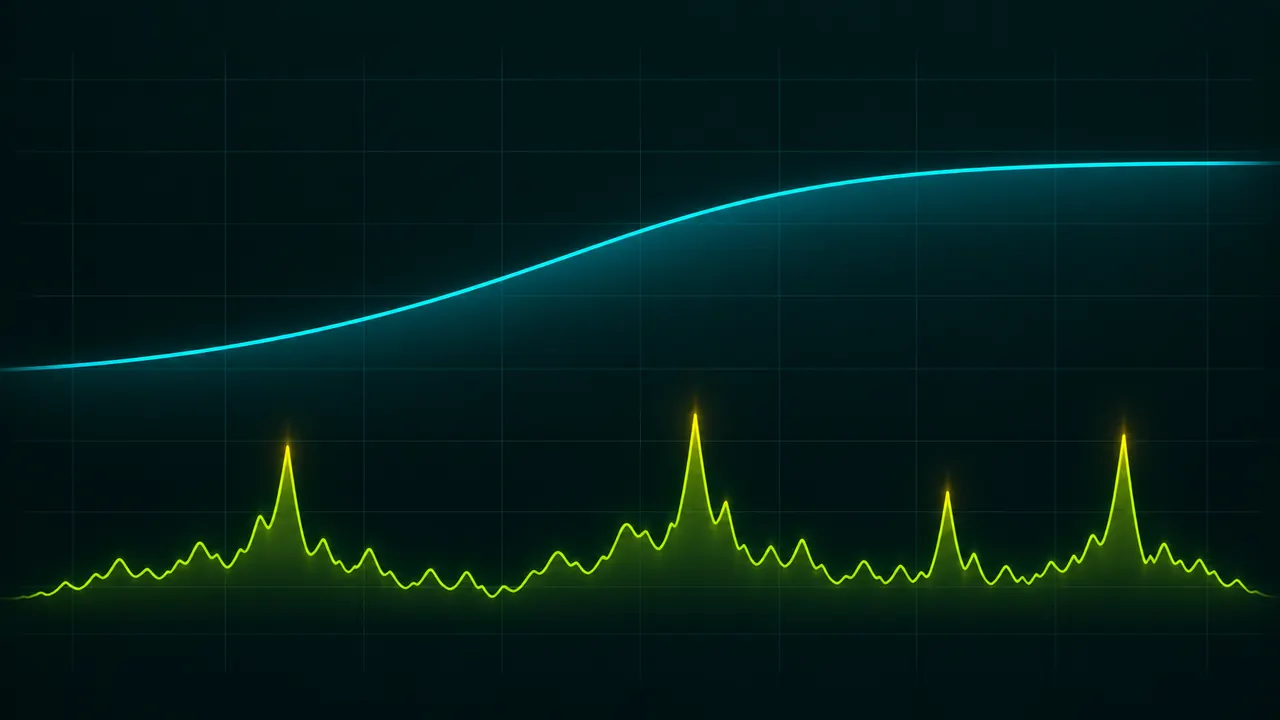
Two invented games, the same average, different sessions
Published per-title figures belong on the game pages, so the demonstration below uses two games that do not exist. Each has one paying outcome, so every step is checkable by hand.
Game A returns twice the stake on 48 rounds in every hundred and nothing on the rest. Its mean is 0.48 multiplied by 2, which is 0.96 of stake. Its variance is 0.48 multiplied by 4, less 0.96 squared: 1.92 minus 0.9216, or about 1.00. Its volatility is the square root of that, about 1.0 stakes.
Game B returns two hundred times the stake on 48 rounds in every ten thousand and nothing on the rest. Its mean is 0.0048 multiplied by 200, which is also 0.96 of stake, identical to Game A. Its variance is 0.0048 multiplied by 40,000, less the same 0.9216: about 191. Its volatility is the square root of that, about 13.8 stakes, near fourteen times Game A's.
Now run four hundred rounds at a dollar through each. Turnover is A$400 in both cases, because turnover is stake times rounds and has no distribution attached. The modelled return is A$384 and the modelled loss A$16 in both cases, because those are set by the mean alone and the means are equal. Every quantity usually quoted about these two games is the same.
The sessions are not. In Game A the standard deviation of the whole session's return is the per-round figure multiplied by the square root of 400, so about A$20: results cluster within a few tens of dollars of A$384 and the average is close to the typical experience. In Game B the same multiplication gives roughly A$276, a band wider than the total staked. The chance of four hundred rounds producing no paying outcome at all works out at about one session in seven, while a single paying round returns A$200. Most sessions finish well below the mean and a few far above it, which is the signature of right skew: the average is not the typical outcome and should not be used as though it were.
The decision rule here is the most portable thing on the page. When a game's return is concentrated in a rare event, stop planning with the average; treat the mean as a description of the game rather than a forecast of your evening.
// sponsored · Safe Casino · 18+
+500% + 120 free spins
Safe Casino welcome offer. Check the qualifying deposit and wagering conditions before you claim.
The published rating, and why it does not compare across studios
What you get to read is rarely a standard deviation. It is usually a word — low, medium, high — or a one-to-five bar in the game's information panel. A minority of studios publish a numeric figure or index. Where only a label exists, it is that studio bucketing its own computed standard deviation against its own internal thresholds, and those thresholds are not standardised across the industry. A medium from one studio and a medium from another are not the same quantity, so ranking games from different studios by label is an arithmetic error dressed as a comparison.
Three fields in the same panel proxy dispersion better than the label does, and are published more consistently. The maximum-win cap as a multiple of stake tells you how far the tail may run. The feature trigger frequency, where stated, tells you how rare the event carrying the return is. The top of the paytable tells you whether ordinary symbol combinations can pay a large multiple or whether everything of consequence happens inside the feature. A high cap next to a rarely triggering feature describes a high-dispersion game whatever the label says. Where the panel is silent on a field, record it as unknown; borrowing a figure from a similarly named title is how most wrong volatility claims get made.
Read all of this inside the live game, in the lobby you intend to play in, because the operator chooses which build of a title it integrates and the volatility field describes the loaded build. If you want somewhere to run that panel check, Safe Casino and WinCrown are the sponsored lobbies linked from this site; open the live page and see what is listed, because that is not something this page can verify for you.
Figures differ between builds and lobbies. Read the live game's information panel before you rely on any of them.
Play here →Four things volatility does not predict
It does not predict your next round. A standard deviation is a property of a distribution, not a position in a sequence. Rounds are independent, so a wide distribution does not narrow after a quiet stretch and owes nothing back. Your next spin draws from the same population of outcomes the last one did.
It does not predict how long a balance lasts. The claim that high volatility empties an account quickly is true only of the losing region of the distribution, and a distribution is wide in both directions by definition. An early feature hit on a high-dispersion game can fund a longer session than a low-dispersion game would; the symmetric possibility is a very short one. Volatility is the reason session length is unpredictable, which makes it a poor instrument for predicting it.
It does not predict whether you reach the maximum win. The cap bounds the tail and the volatility says the tail is heavy. Neither gives the probability of a specific point in that tail, and that probability is rarely published. A heavy tail and a reachable tail are different claims.
It does not predict the return figure. Volatility and return to player are independent parameters of the model; a studio can move either without touching the other and routinely does, so “high volatility means a higher return” and its opposite are both false as general rules. Nor does it describe the distribution's shape beyond its width; skew and tail mass are separate properties the single figure discards.

Mistakes that come from the word rather than the maths
Treating low volatility as low risk. Everyday risk means the chance of a bad outcome; here it means spread. A narrow spread around a negative mean produces a more reliable loss, not a smaller one: over the same turnover the modelled loss is fixed by the return figure alone. Low volatility buys predictability, which is a real thing to want and is not safety.
Reducing stake to cope with high volatility. It is a sensible way to cut money at risk and it does nothing to the game. Stake scales every dollar figure and leaves the distribution in stake multiples exactly where it was. What it buys is more rounds for the same money, which moves you slightly along that square-root curve. Slightly, because the curve is slow.
Expecting a stopping rule to change expectation. Deciding in advance to stop at a loss or a win reshapes the distribution of your session outcome, which is genuinely useful for keeping a budget intact. It does not touch the expectation of any individual round, and no arrangement of stopping rules turns a negative per-round mean positive. The rule is a budgeting instrument, not an edge.
Calibrating a game on a few dozen rounds. People try a title briefly and conclude it is tight or generous. At that round count the confidence band is vastly wider than any difference between two builds of the same game, so the conclusion carries no information. The square-root shrinkage is far slower than intuition expects, which is why a small sample feels conclusive, and why two players at different stakes on one game end up with identical volatility and incompatible anecdotes.
Reading a guaranteed feature entry as reduced volatility. Removing the wait for a trigger removes one source of variance and concentrates what is left into fewer, more expensive rounds. Certainty about cost is not certainty about outcome, and fewer rounds means less square-root shrinkage, not more.
// sponsored · WinCrown · 18+
+500% + 120 free spins
WinCrown welcome offer. Read the current promotion terms, eligibility and withdrawal conditions.
What the arithmetic will actually support
Turnover is the first quantity on a pokie that carries no probability: stake multiplied by rounds. Forty cents across five hundred rounds generates A$200 whatever happens on screen, and that is knowable before you start. It is also the figure a wagering requirement is usually written against, so the arithmetic earns its keep beyond the game's maths.
The second is the worst case, which is the full amount you put through. Set it before a game loads and treat it as already spent. Everything between those poles, including how long it takes and whether the feature arrives, is the distribution, and the volatility figure describes its width rather than its schedule.
What volatility legitimately earns you is a choice about the texture of the entertainment, and that is the only choice it supports: many small outcomes and a thin tail, or long stretches of nothing and the possibility of something large. Choosing a dispersion in the belief that it improves the average asks the figure for something it cannot give.
Stated as a sequence: budget first, because it is certain; dispersion second, because it is the part you experience; return figure last, because it is a limit the maths approaches over a volume of play no person reaches. Reversing that order is how a reader of pokies maths ends up worse informed than when they started.
What this page could not verify
No per-title volatility figures appear here. Labels and indices are published per build inside the loaded game, and a figure copied onto a guide page is a snapshot of one build in one lobby on one day.
Game A and Game B are invented and stated to be invented. Their arithmetic is correct for games with those made-up probabilities and nothing else; no real pokie has one paying outcome, and no claim about a real title should be drawn from them. The account of how studios bucket volatility into labels is general; this page inspected no particular studio's thresholds.
This page's one practical instruction is to read a dispersion field inside a live lobby, so the standing of those lobbies belongs beside it. Online casino services cannot lawfully be provided to people in Australia, and the lobbies linked from this site are offshore. A volatility label or Australian dollar pricing shown in one is the operator's own presentation of the build it loaded, and establishes no Australian authorisation behind it. Sponsored links can earn this publisher a commission.
Nothing here is a method for winning. Volatility is a width, the mean it surrounds is negative for the player, and no reading of either changes that: a wide game is not a generous one, it is an uncertain one. Decide the full amount you are prepared to lose before a game loads, keep it clear of money needed for essentials, and read a long run of nothing as the distribution doing exactly what its width predicted rather than as a reason to continue.
Questions people actually ask
What is volatility in pokies?
It is the standard deviation of the return from a single round, stated in multiples of the amount staked. It describes how widely individual round outcomes are spread around the game's average return, not how large that average is.
What is the formula for pokies volatility?
Sum each outcome's probability multiplied by the square of its return in stake multiples, subtract the square of the mean return, then take the square root. Technical standards usually report that figure multiplied by a confidence constant, which turns it into a readable interval.
Is volatility the same as hit frequency?
No. Hit frequency counts how often a round returns anything at all, including returns smaller than the stake. Volatility weights outcomes by size after squaring them, so the top of the paytable dominates it. A game can pay often and still be extremely dispersed.
Does a lower stake reduce volatility?
No. Volatility is stated per unit of stake, so it is unchanged by stake size. A smaller stake reduces the dollar size of every swing and the money at risk per round, which is worth doing for budget reasons, but the shape of the distribution is identical.
Does high volatility mean a higher RTP?
No. Spread and mean are independent parameters of the game model, and a studio can change one without touching the other. Both "high volatility means a better return" and the reverse are false as general rules.
Where do I read a game's volatility?
Inside the live game's information panel, in the lobby you intend to play in, because the operator chooses which build it integrates. Expect a word or a one-to-five bar rather than a number, and treat labels from different studios as non-comparable because the thresholds behind them are not standardised.
// next step
A paytable makes more sense with the game open in front of you.
View current offer